TDA7490
Figure 4.
Distortion vs. Output Power
THD
(%)
5
2
1
0.5
0.2
0.1
0.05
0.02
0.01
0
2
4
6
8
10
12
14
16
18
20
22
24 P
O
(W)
Stereo
V
S
卤 21V; Rl=8鈩?
f=1KHz
D99AU1088
Figure 5.
Distortion vs. Output Power
THD
(%)
5
2
1
0.5
0.2
0.1
0.05
0.02
0.01
0
2
4
6
8
10
12
14
16
18
20
22
24 P
O
(W)
Stereo
V
S
卤 16V; Rl=4鈩?
f=1KHz
D99AU1089
Figure 6.
Crosstalk vs. Frequency
CT
(dB)
-20
-30
-40
-50
-60
-70
-80
-90
-100
0.001
V
S
卤 21V;
Rl=8鈩?
0dB=1W
D99AU1090
Figure 7.
Frequency Response
AMP
(dB)
2
0
-2
-4
-6
-8
-10
-12
-14
0.01
V
S
卤 21V;
Rl=8鈩?
0dB=1W
D99AU1091
0.01
0.1
1
f(KHz)
0.1
1
10
f(KHz)
Figure 8.
Power Dissipation vs. Output Power
8
7.5
7
6.5
6
5.5
5
4.5
4
3.5
3
2.5
2
1.5
1
0.5
0
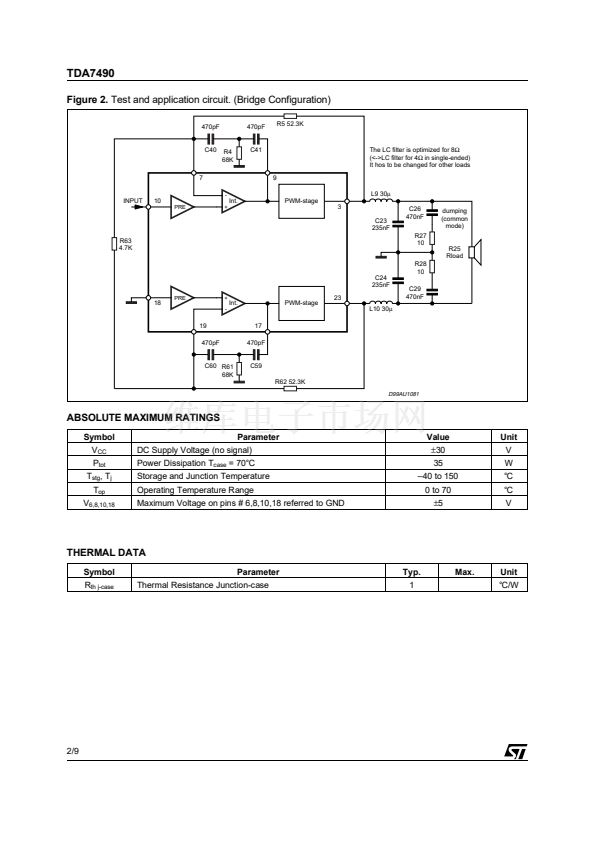
Figure 9.
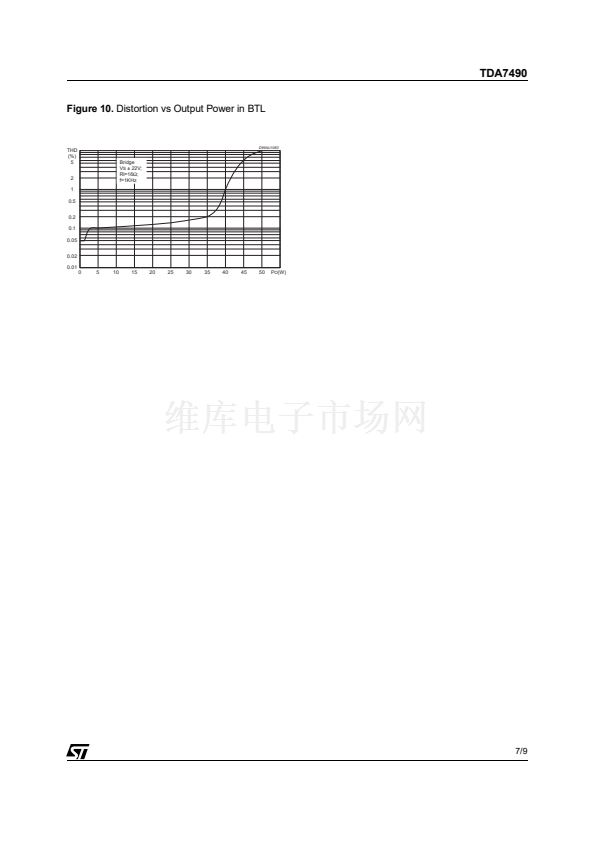
Distortion vs Output Power in BTL
THD
(%)
5
D99AU1082
Power Dissipation (W)
Bridge
V
S
卤 17V;
Rl=8鈩?
f=1KHz
Vs= +/- 21 V; Rl = 8 Ohm; f= 1 KHz
2
1
0.5
0.2
0.1
0.05
0.02
0
2
4
6
8
10 12 14 16 18 20 22 24 26
Output Power (W)
0.01
0
5
10
15
20
25
30
35
40
45
50
P
O
(W)
6/9


 1
1
 2
2
 3
3
 4
4
 5
5
 6
6
 7
7
 8
8
 9
9
