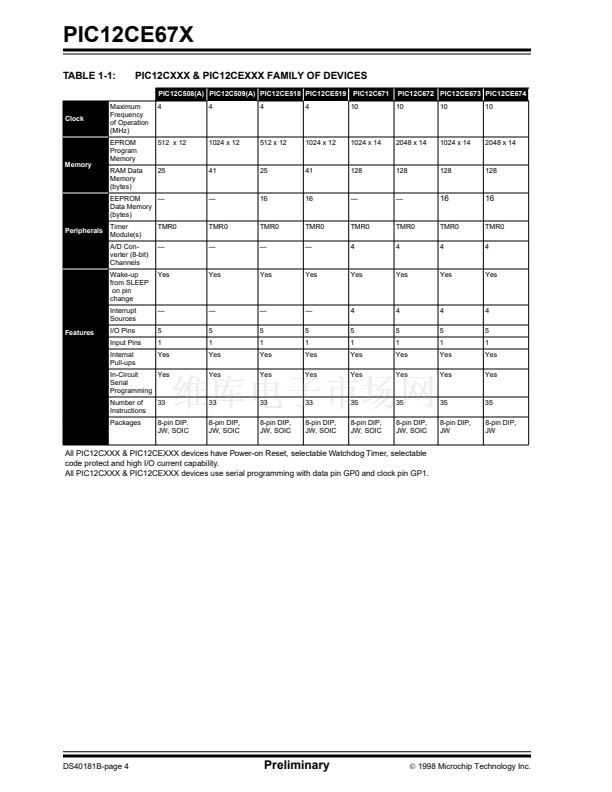
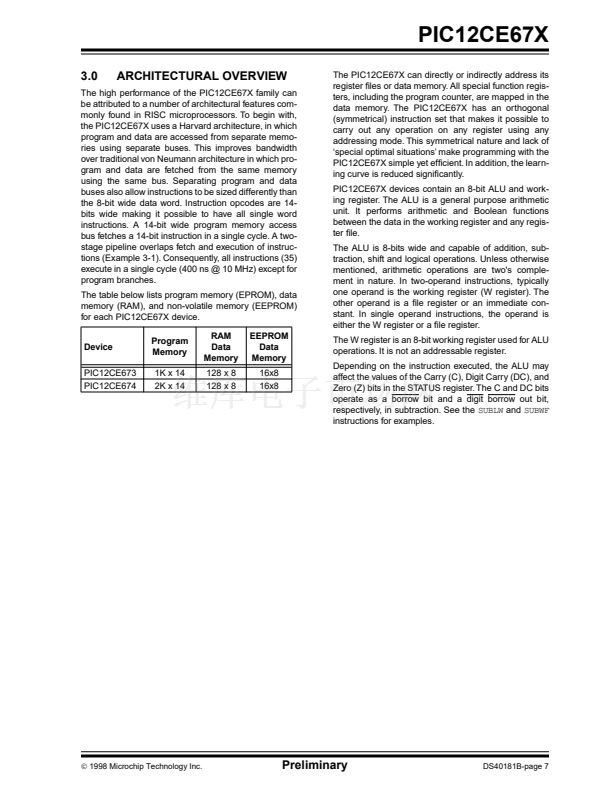
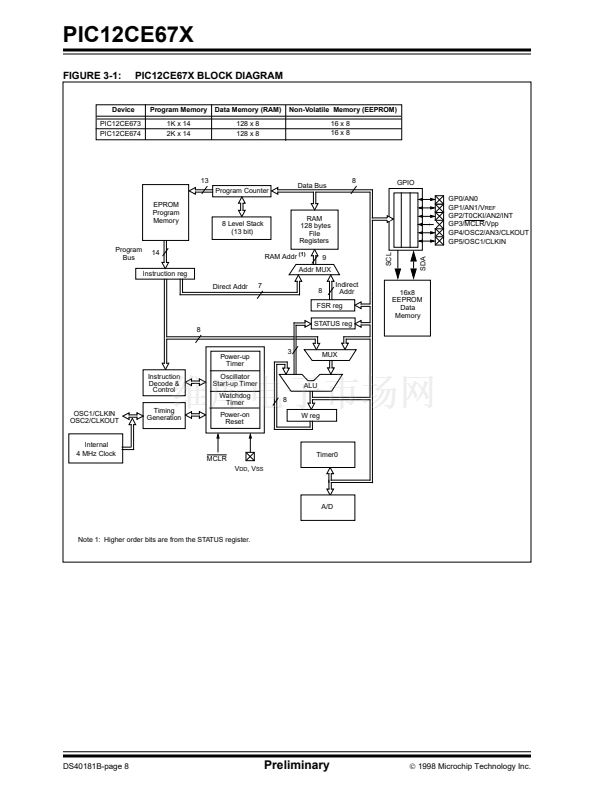
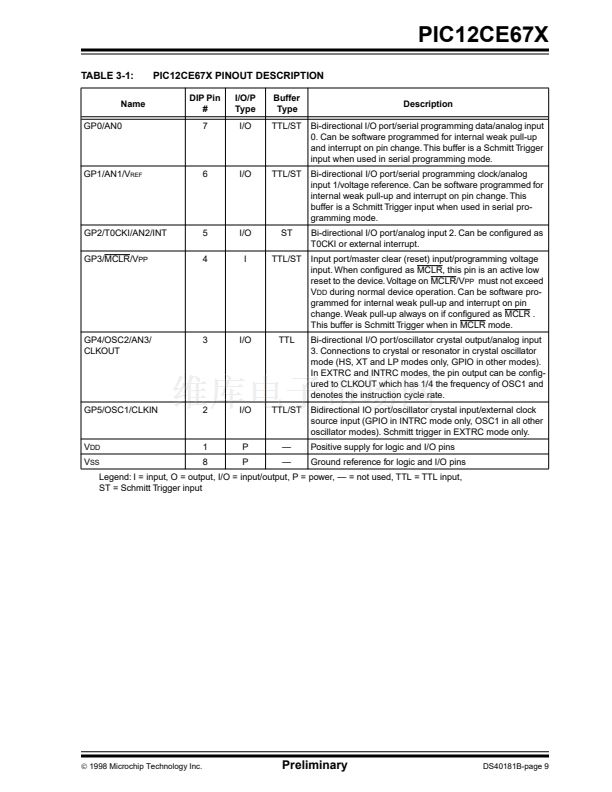
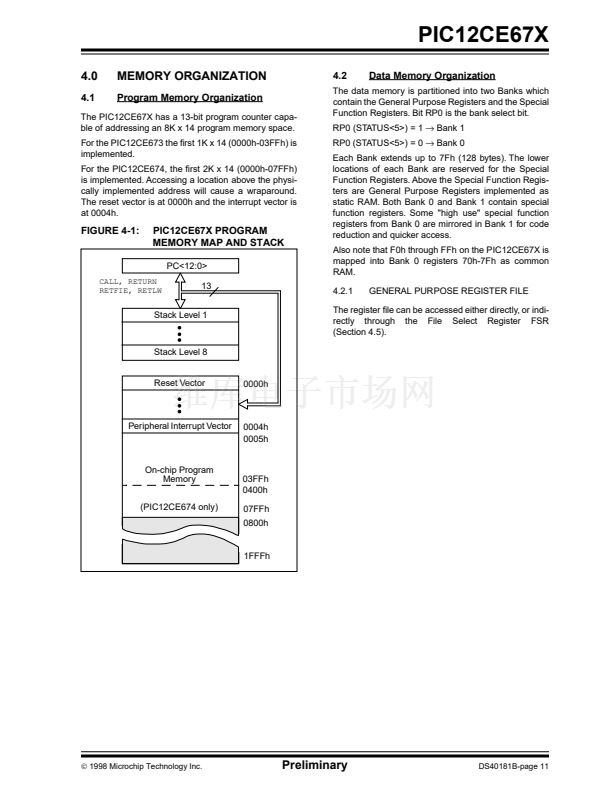
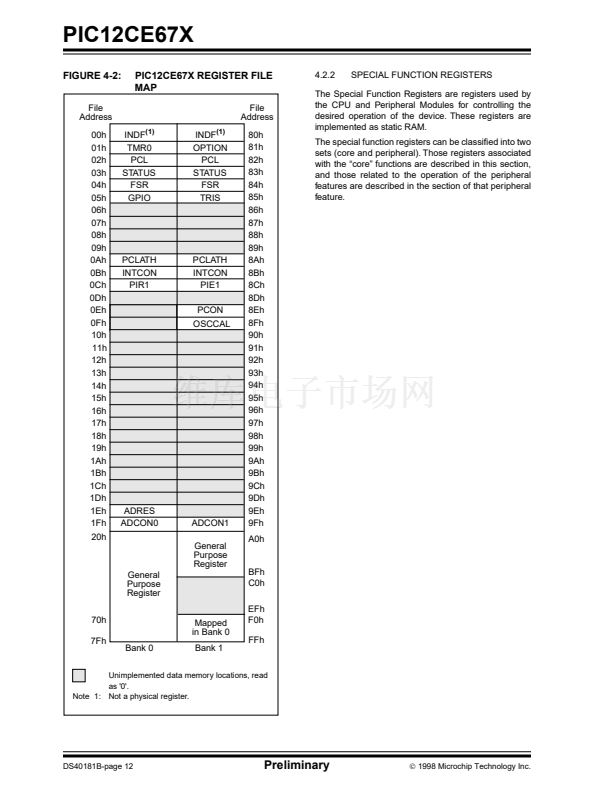
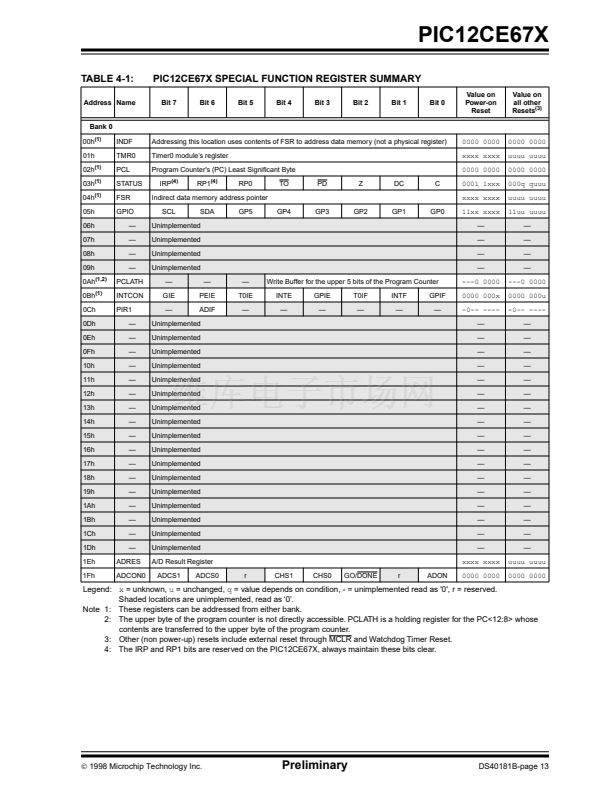
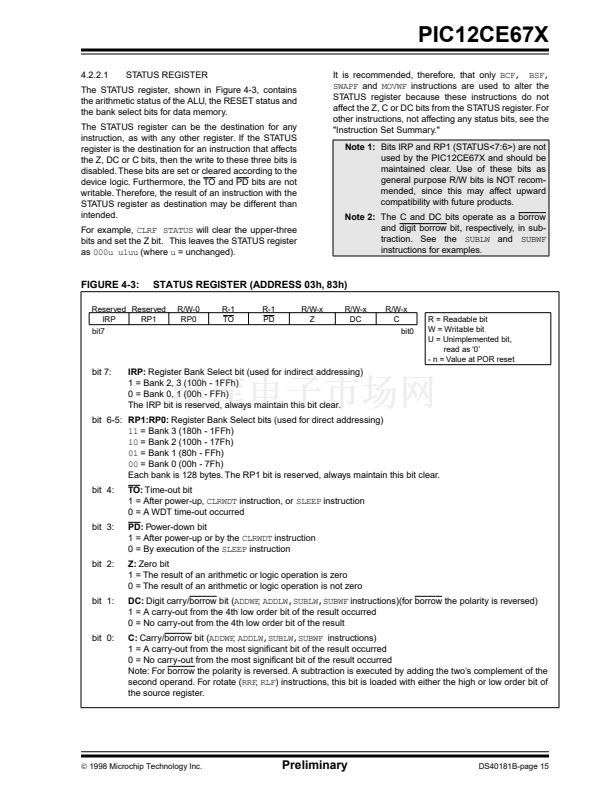
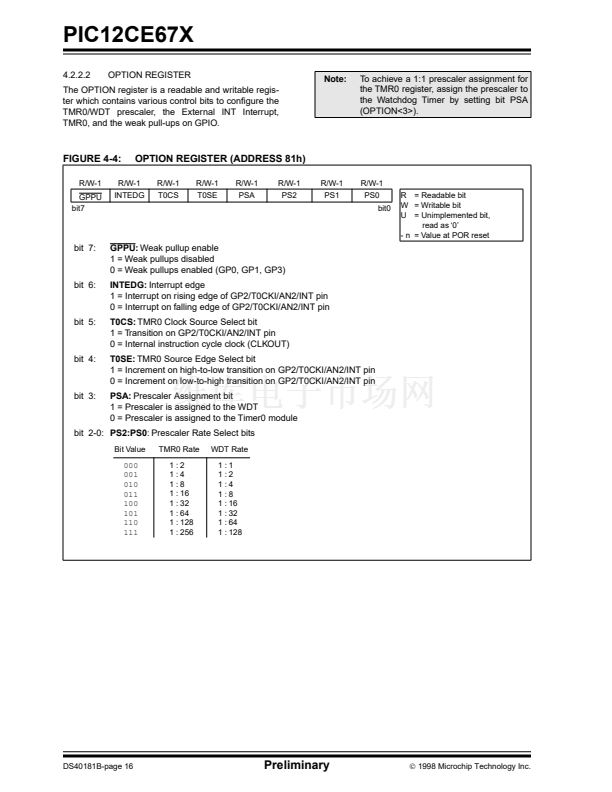
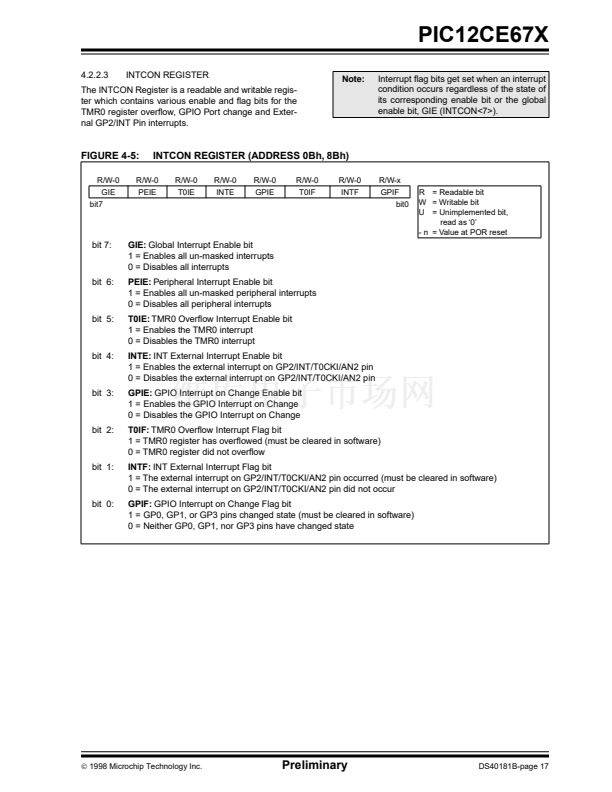
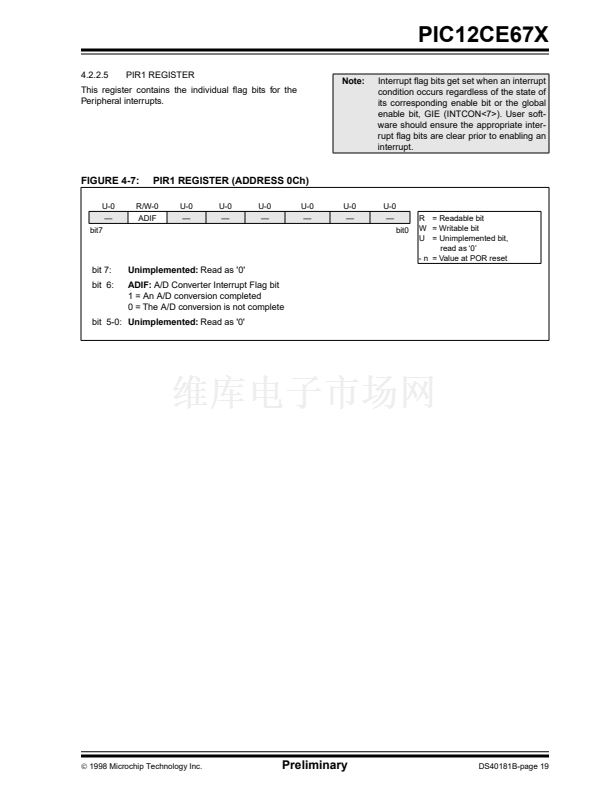
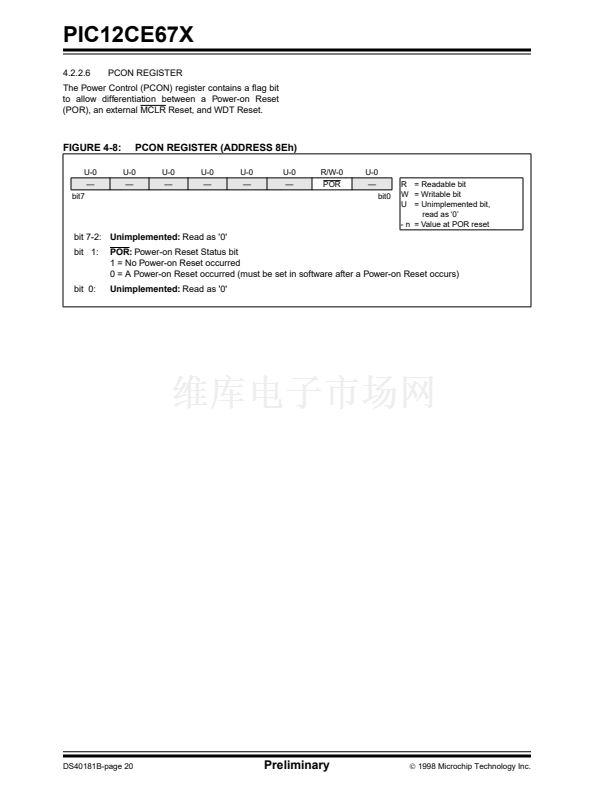
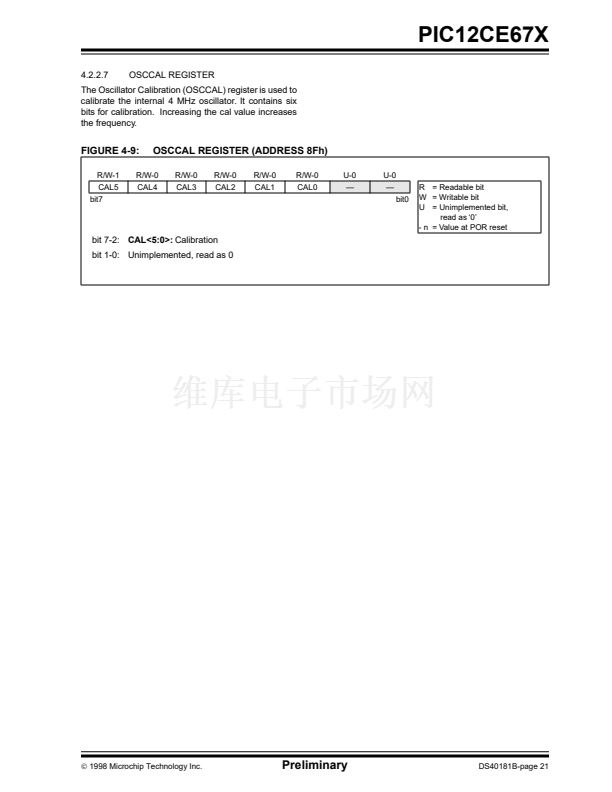
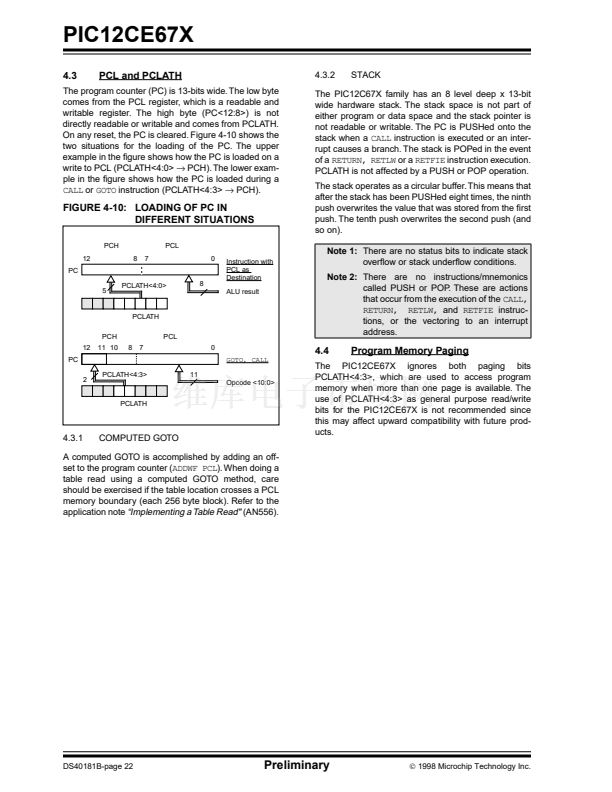
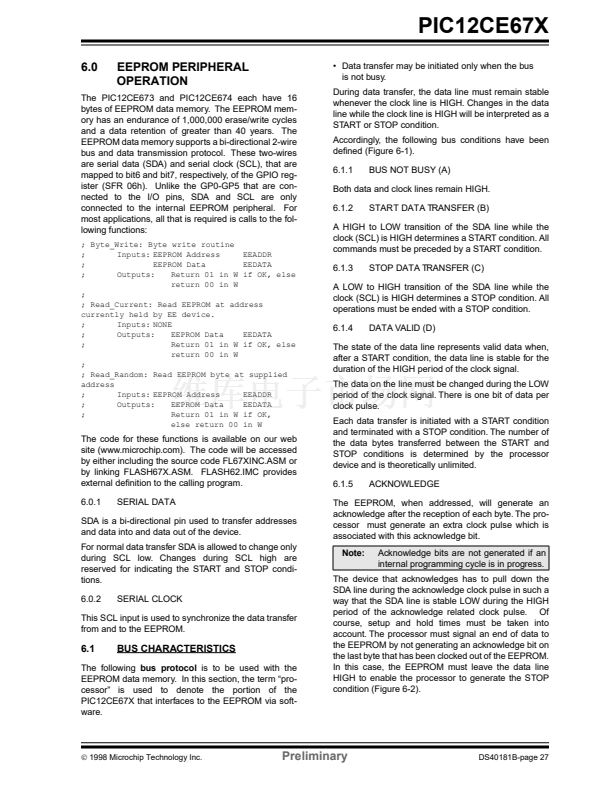
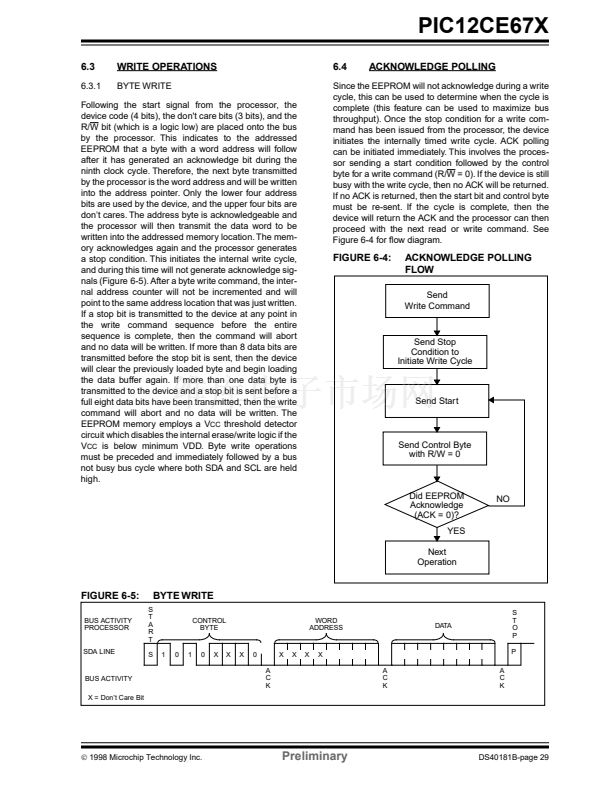
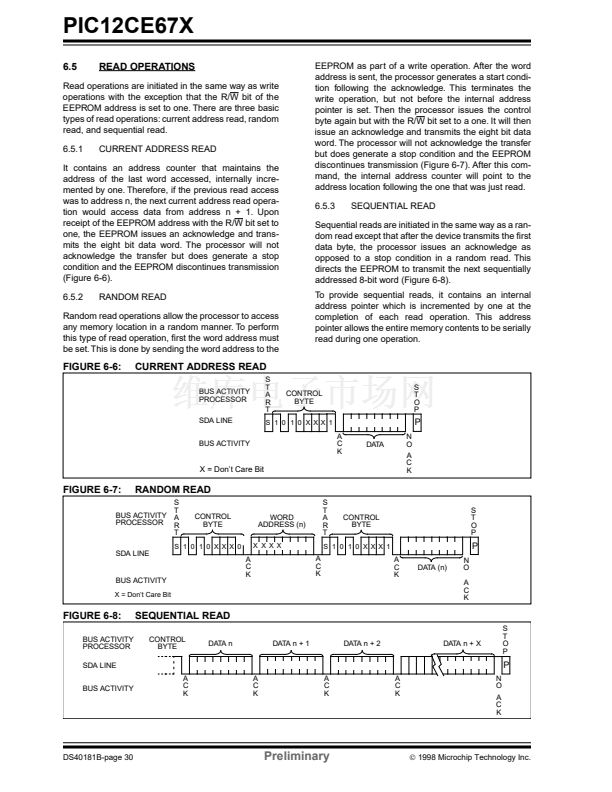
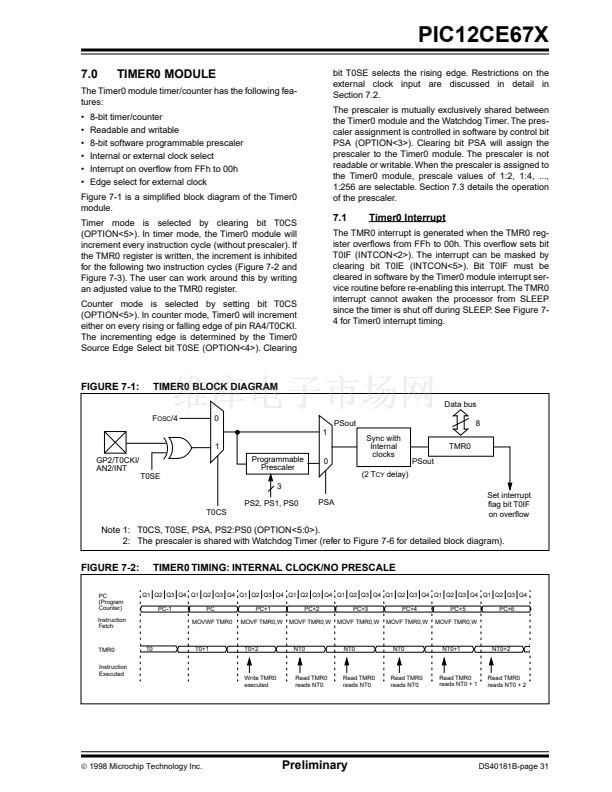
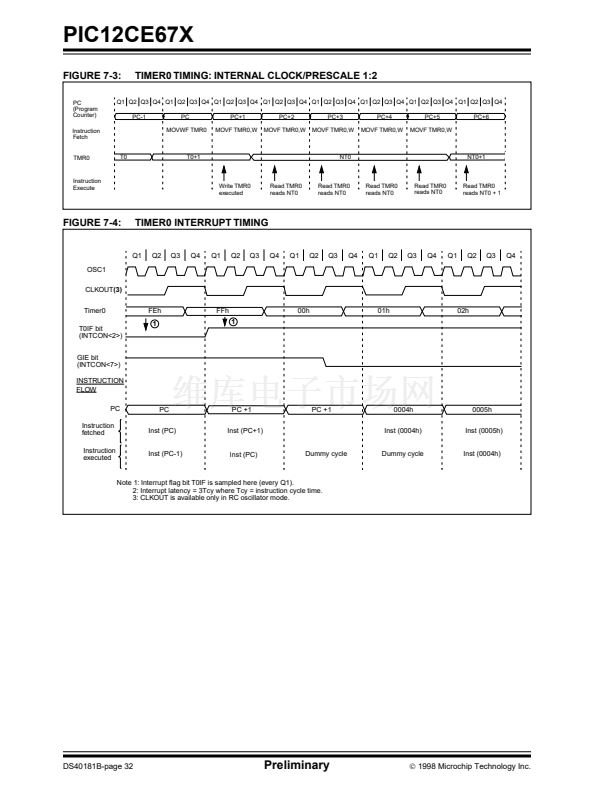
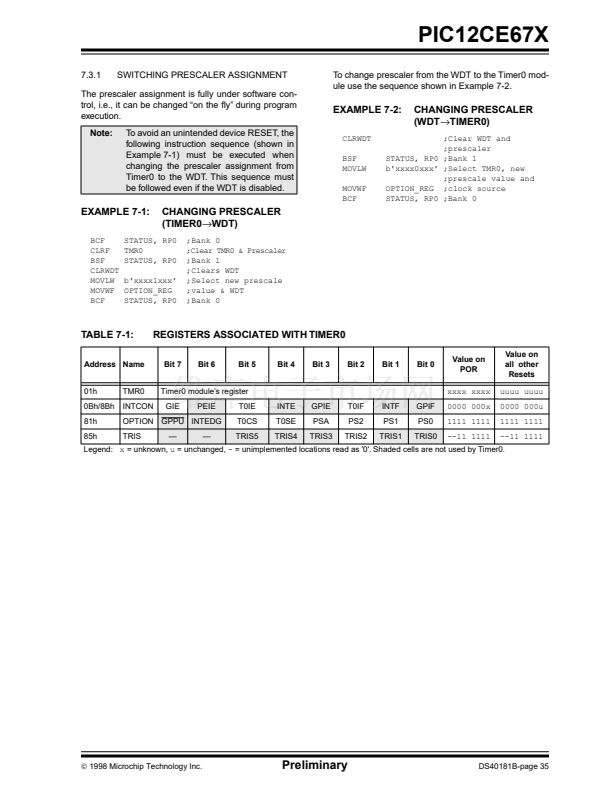
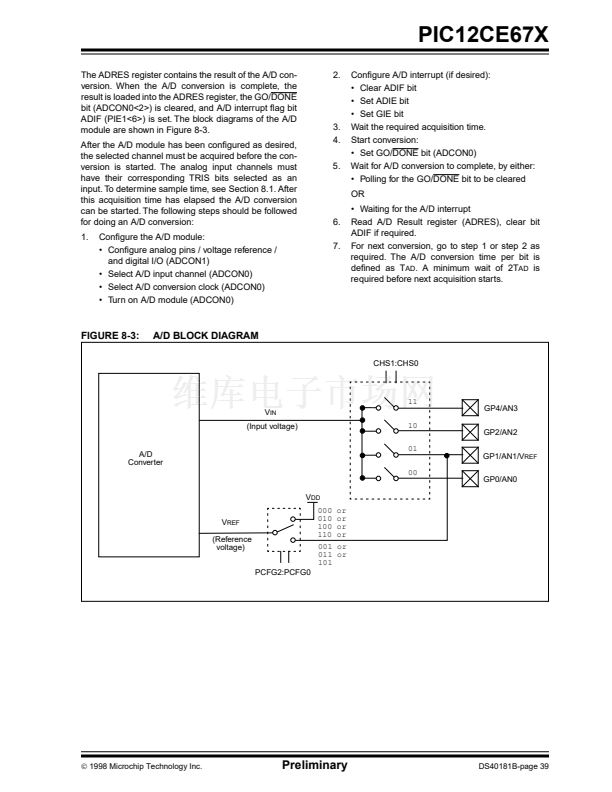
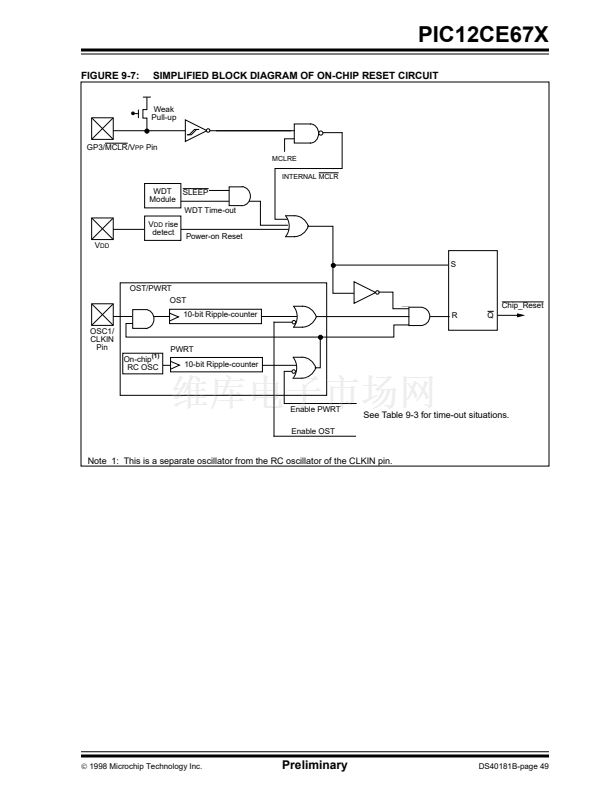
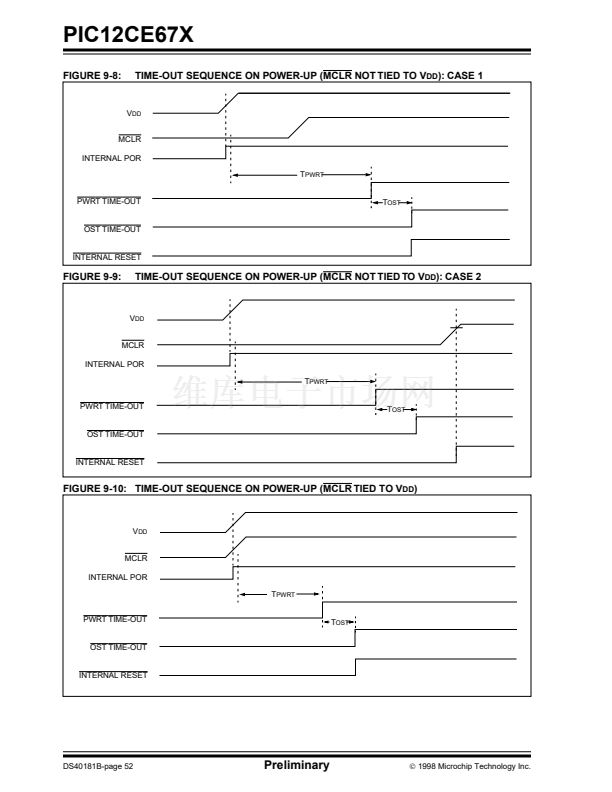
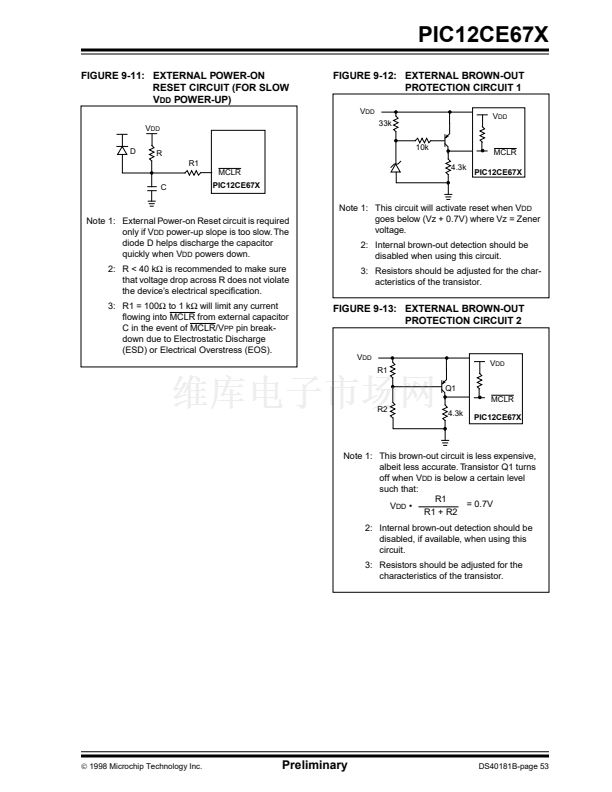
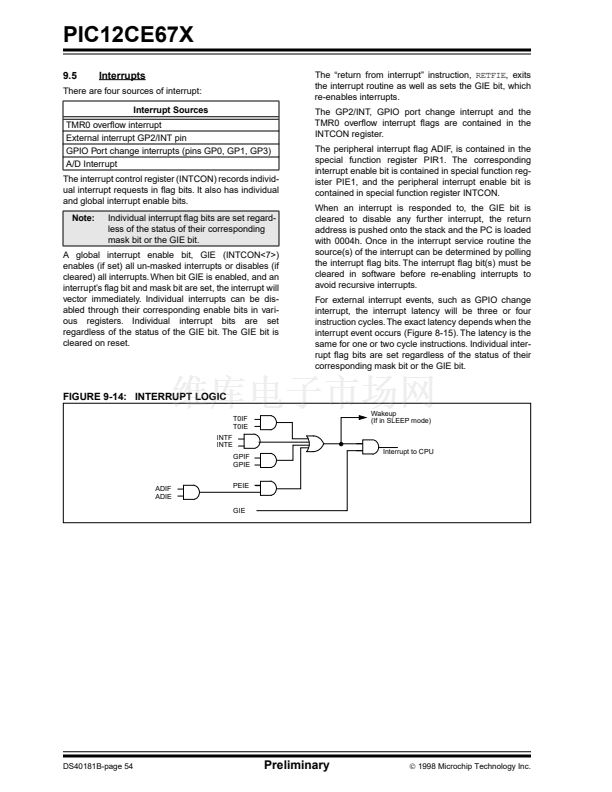
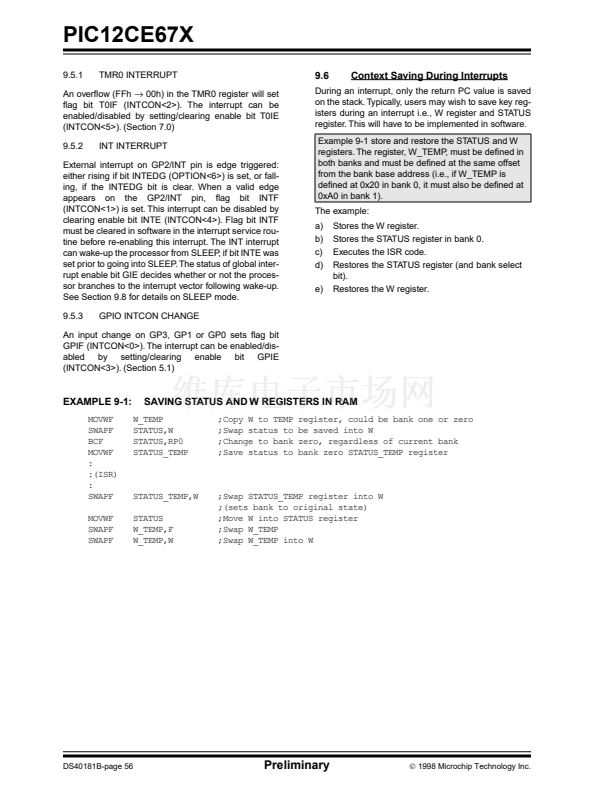
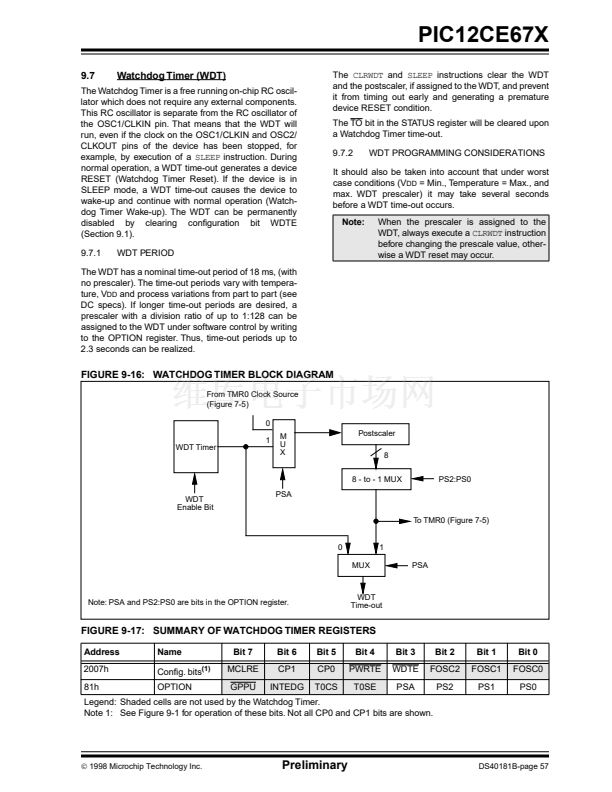
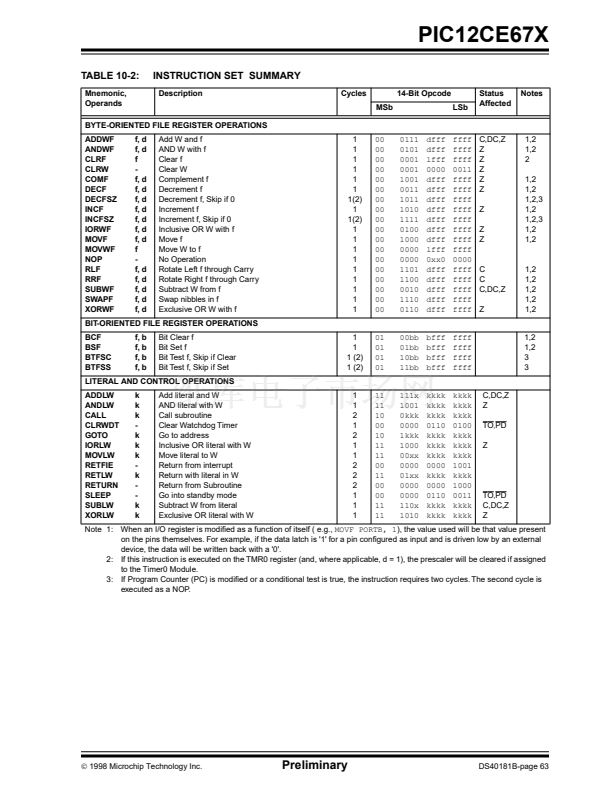
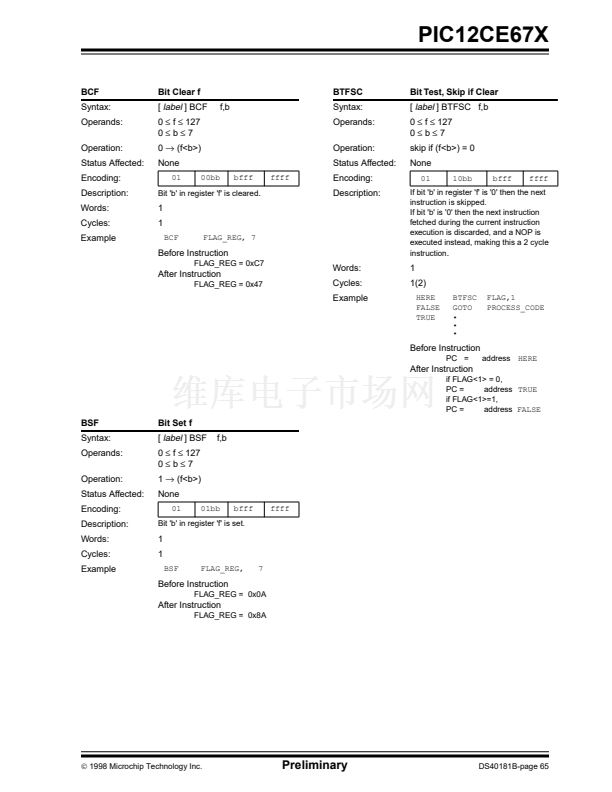
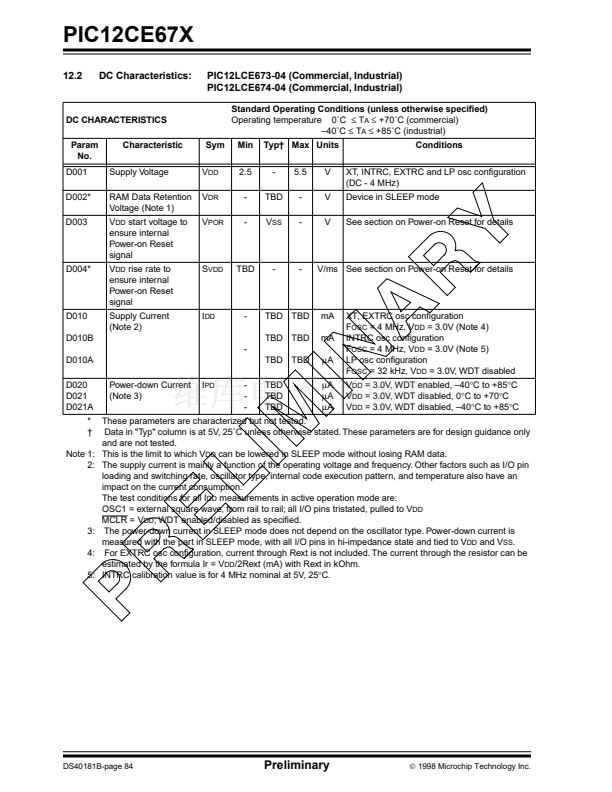
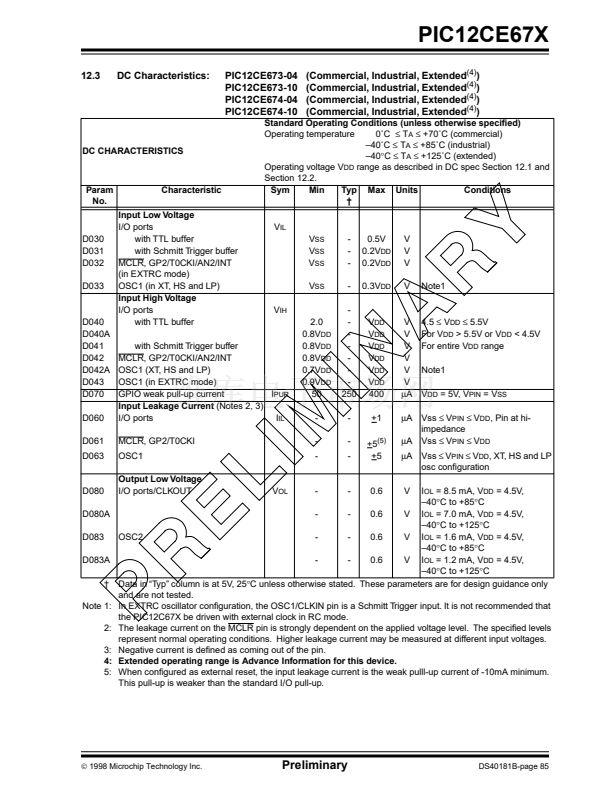
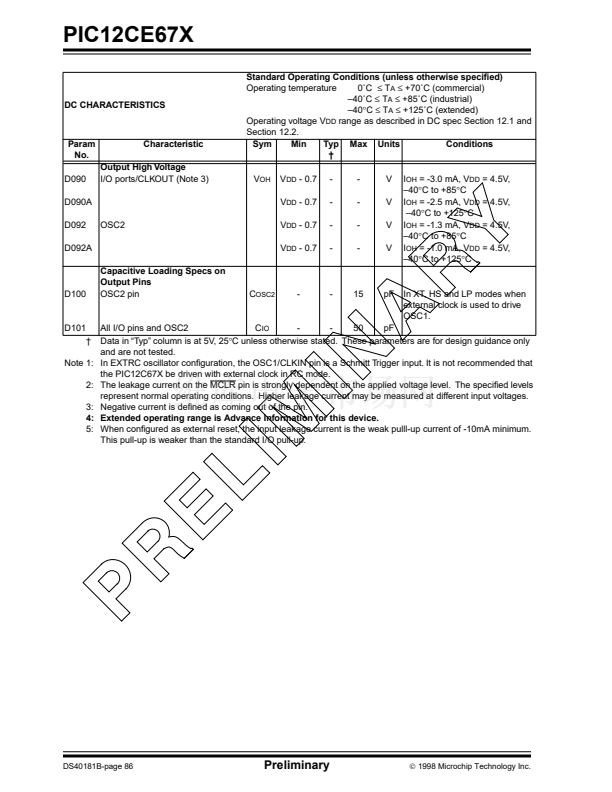
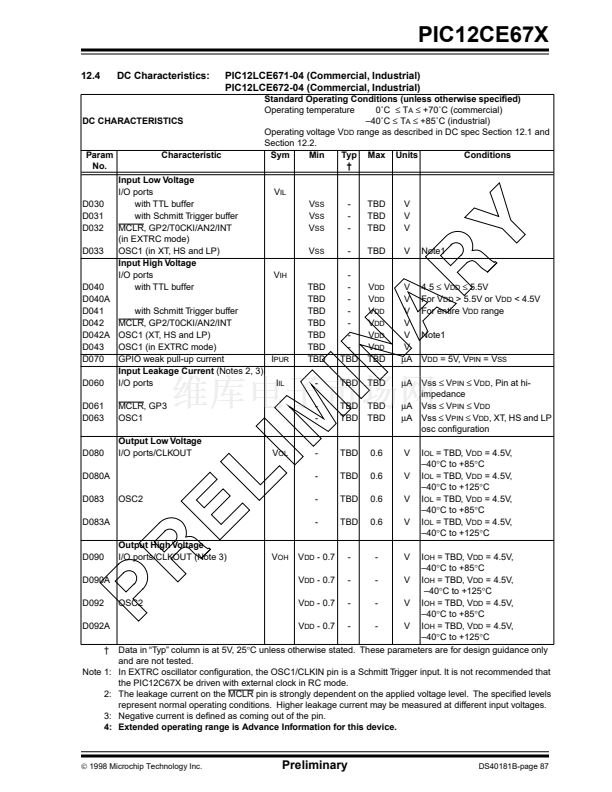
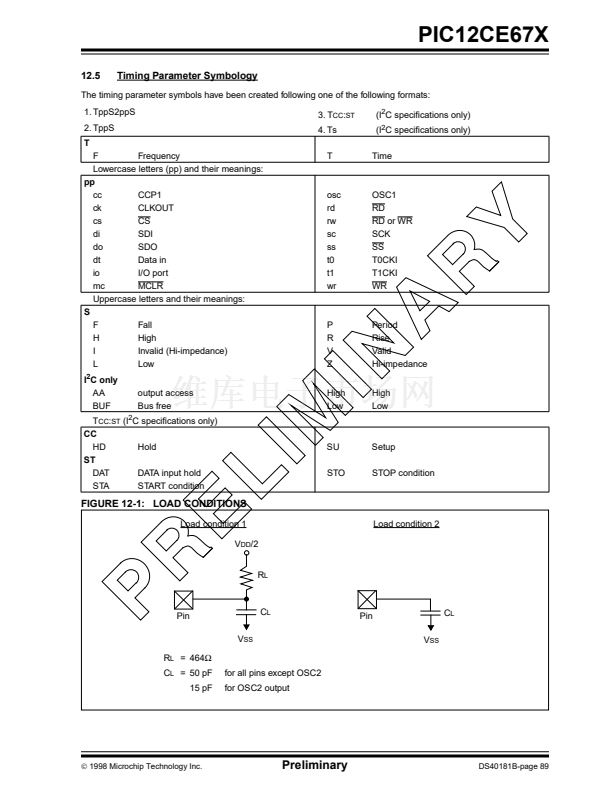
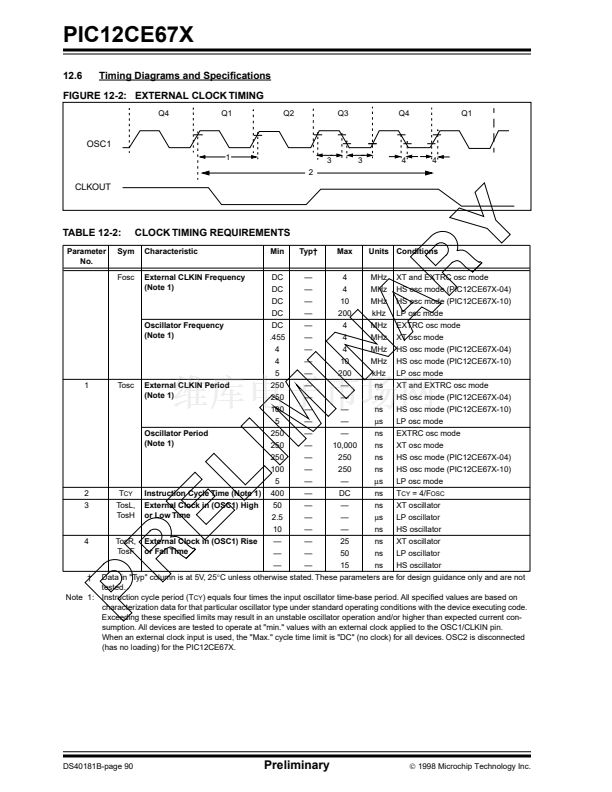
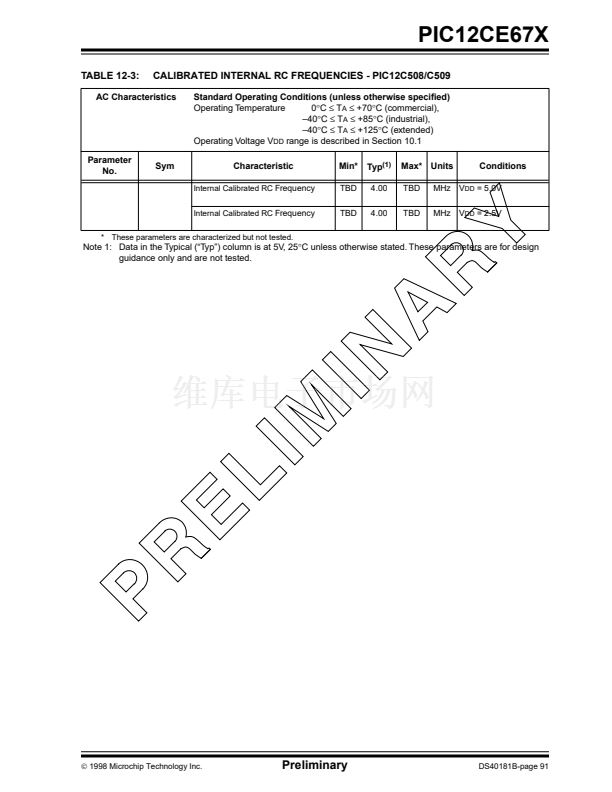
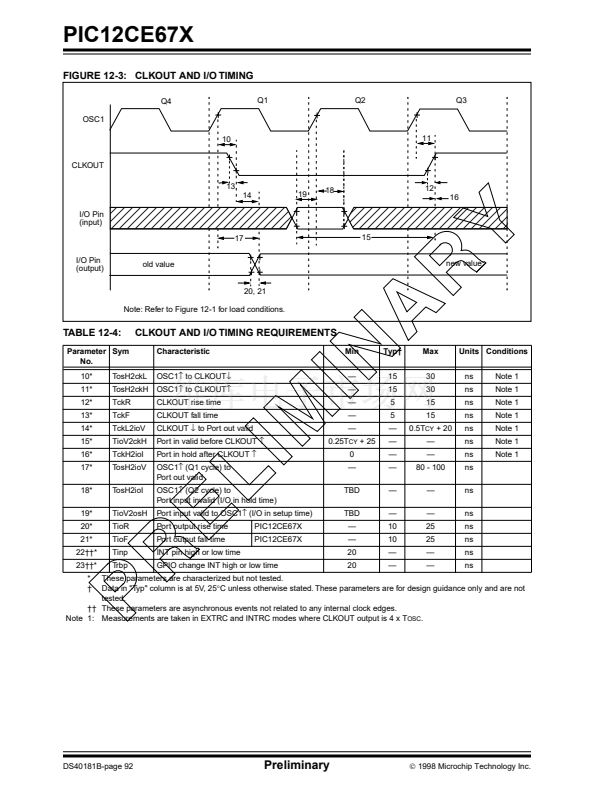
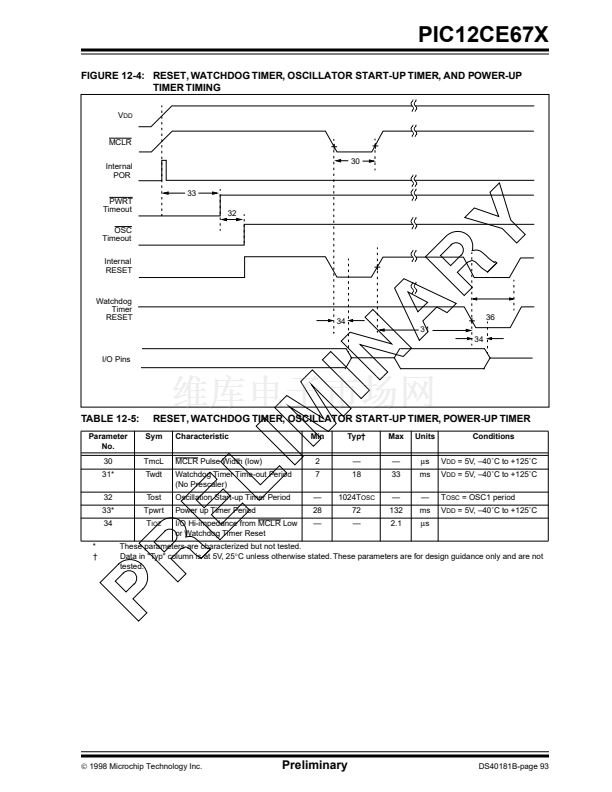
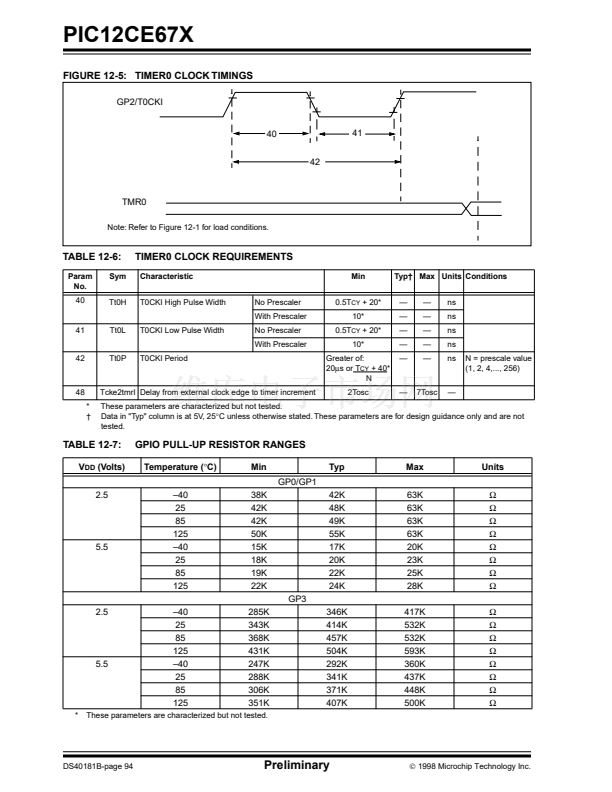
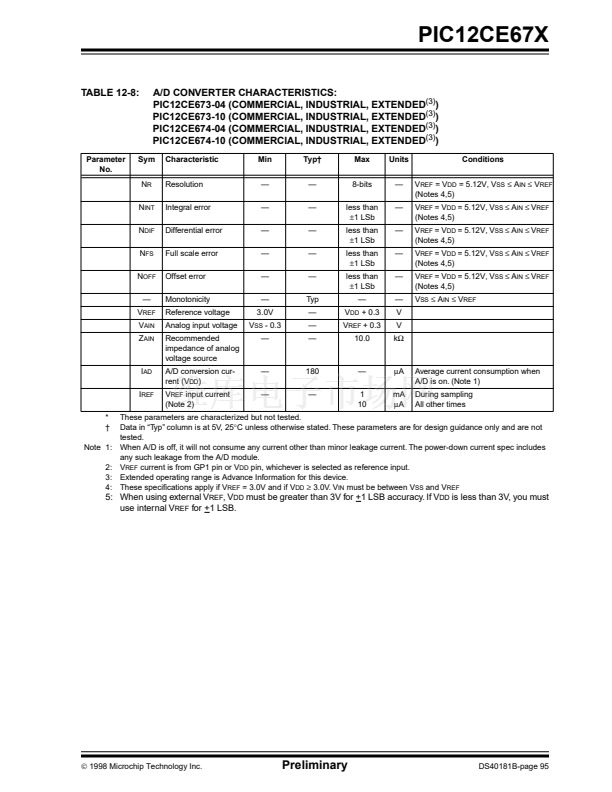
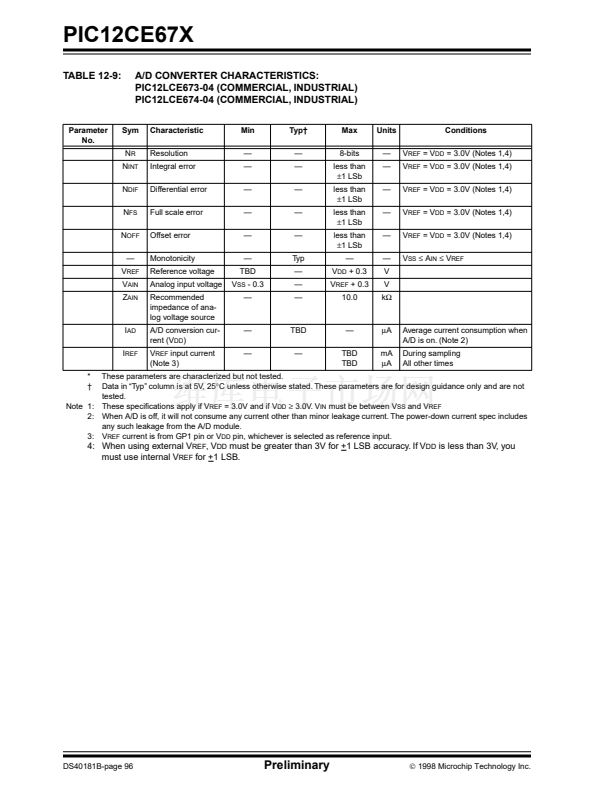
PIC12CE67X
13.0
DC AND AC CHARACTERISTICS - PIC12CE67X
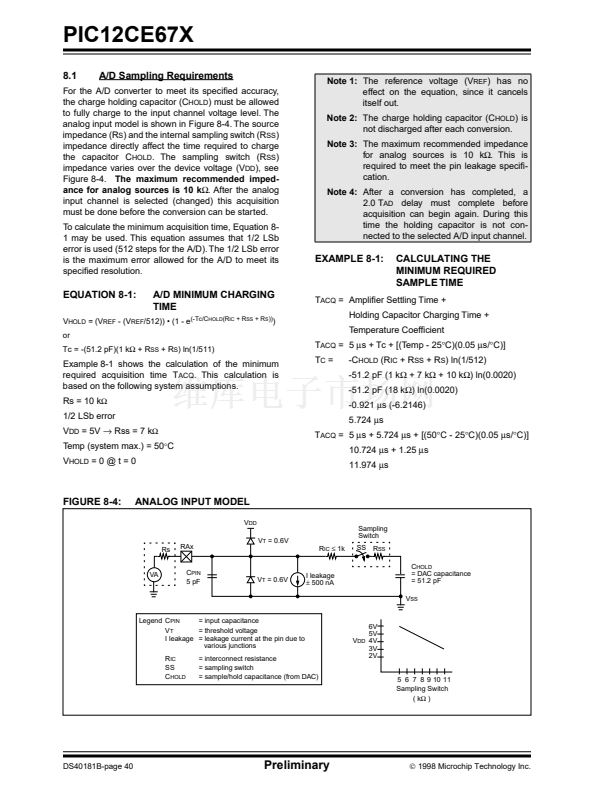
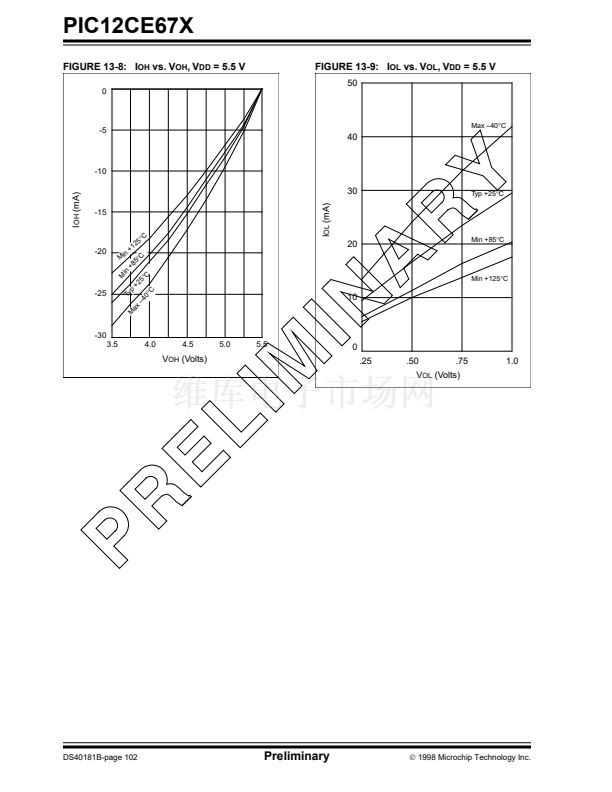
The graphs and tables provided in this section are for design guidance and are not tested. In some graphs or tables the
data presented are outside speci铿乪d operating range (e.g., outside speci铿乪d V
DD
range). This is for information only
and devices will operate properly only within the speci铿乪d range.
The data presented in this section is a statistical summary of data collected on units from different lots over a period of
time. 鈥淭ypical鈥?represents the mean of the distribution while 鈥渕ax鈥?or 鈥渕in鈥?represents (mean + 3蟽) and (mean 鈥?3蟽)
respectively, where
蟽
is standard deviation.
FIGURE 13-1: CALIBRATED INTERNAL RC FREQUENCY RANGE VS. TEMPERATURE (V
DD
= 5.0V)
(INTERNAL RC IS CALIBRATED TO 25掳C, 5.0V)
TO BE DETERMINED
FIGURE 13-2: CALIBRATED INTERNAL RC FREQUENCY RANGE VS. TEMPERATURE (V
DD
= 3.0V)
(INTERNAL RC IS CALIBRATED TO 25掳C, 5.0V)
TO BE DETERMINED
漏
1998 Microchip Technology Inc.
Preliminary
DS40181B-page 99


 1
1
 2
2
 3
3
 4
4
 5
5
 6
6
 7
7
 8
8
 9
9
 10
10
 11
11
 12
12
 13
13
 14
14
 15
15
 16
16
 17
17
 18
18
 19
19
 20
20
 21
21
 22
22
 23
23
 24
24
 25
25
 26
26
 27
27
 28
28
 29
29
 30
30
 31
31
 32
32
 33
33
 34
34
 35
35
 36
36
 37
37
 38
38
 39
39
 40
40
 41
41
 42
42
 43
43
 44
44
 45
45
 46
46
 47
47
 48
48
 49
49
 50
50
 51
51
 52
52
 53
53
 54
54
 55
55
 56
56
 57
57
 58
58
 59
59
 60
60
 61
61
 62
62
 63
63
 64
64
 65
65
 66
66
 67
67
 68
68
 69
69
 70
70
 71
71
 72
72
 73
73
 74
74
 75
75
 76
76
 77
77
 78
78
 79
79
 80
80
 81
81
 82
82
 83
83
 84
84
 85
85
 86
86
 87
87
 88
88
 89
89
 90
90
 91
91
 92
92
 93
93
 94
94
 95
95
 96
96
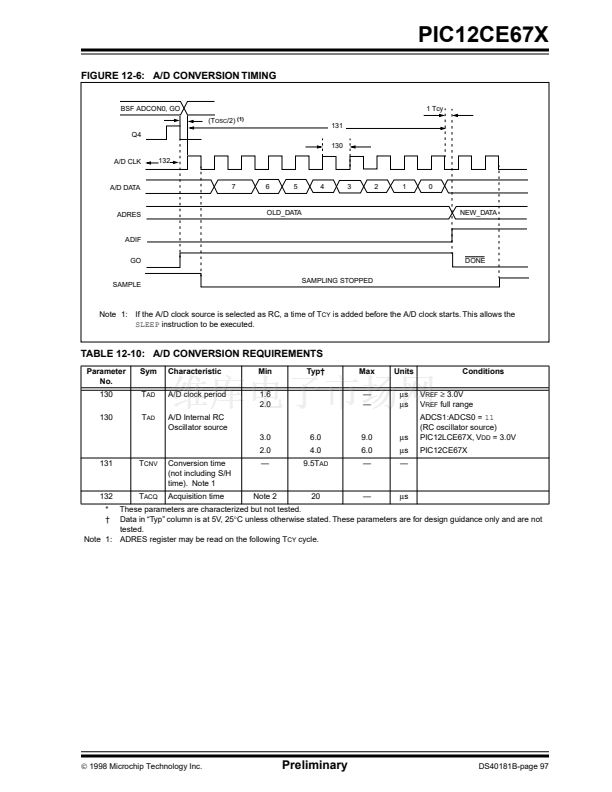 97
97
 98
98
 99
99
 100
100
 101
101
 102
102
 103
103
 104
104
 105
105
 106
106
 107
107
 108
108
 109
109
 110
110
 111
111
 112
112
 113
113
 114
114
 115
115
 116
116
