Data Sheets
Sensitive SCRs
200
100
80
60
50
40
30
10 A Devices
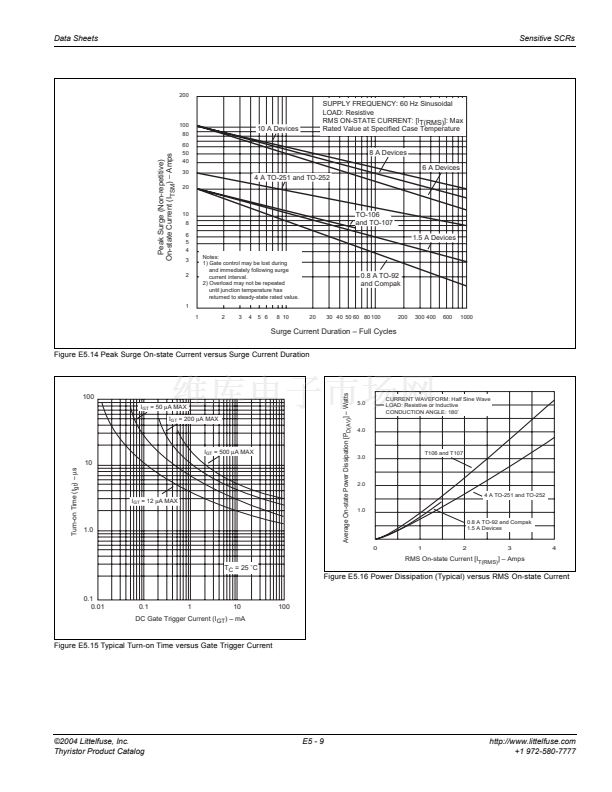
SUPPLY FREQUENCY: 60 Hz Sinusoidal
LOAD: Resistive
RMS ON-STATE CURRENT: [IT(RMS)]: Max
Rated Value at Specified Case Temperature
8 A Devices
6 A Devices
Peak Surge (Non-repetitive)
On-state Current (I
TSM
) 鈥?Amps
4 A TO-251 and TO-252
20
10
8
6
5
4
3
2
Notes:
1) Gate control may be lost during
and immediately following surge
current interval.
2) Overload may not be repeated
until junction temperature has
returned to steady-state rated value.
TO-106
and TO-107
1.5 A Devices
0.8 A TO-92
and Compak
1
1
2
3
4
5 6
8 10
20
30 40 50 60 80 100
200
300 400
600
1000
Surge Current Duration 鈥?Full Cycles
Figure E5.14 Peak Surge On-state Current versus Surge Current Duration
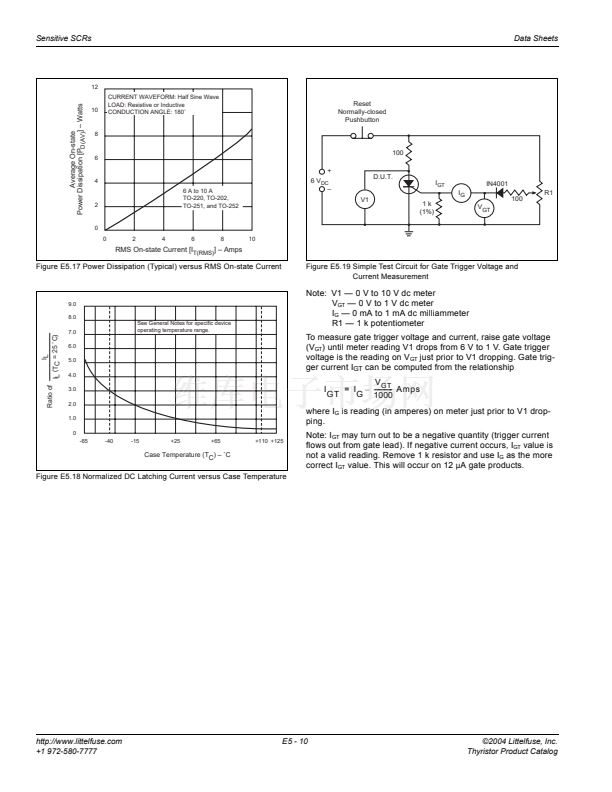
100
I
GT
= 50
碌A
MAX
I
GT
= 200
碌A
MAX
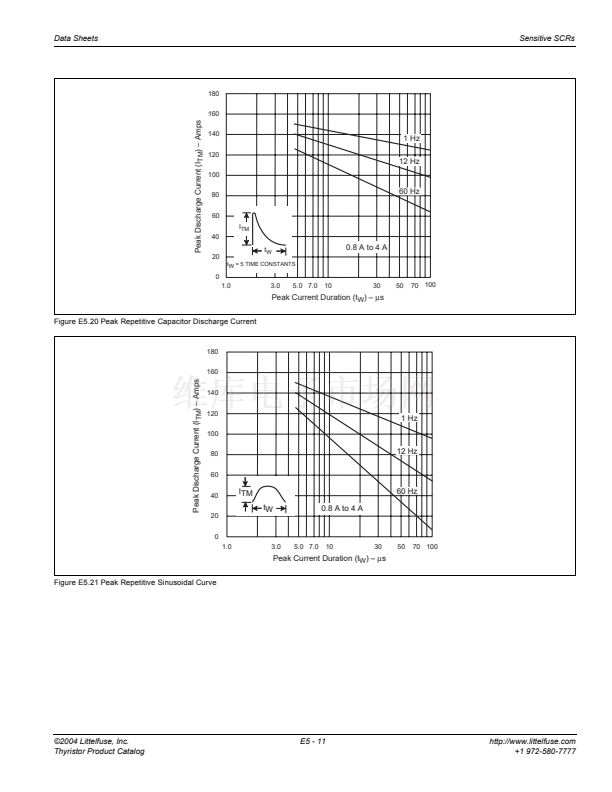
Average On-state Power Dissipation [P
D(AV)
] 鈥?Watts
5.0
CURRENT WAVEFORM: Half Sine Wave
LOAD: Resistive or Inductive
CONDUCTION ANGLE: 180藲
4.0
I
GT
= 500
碌A
MAX
3.0
T106 and T107
10
Turn-on Time (t
gt
) 鈥?/div>
碌s
2.0
4 A TO-251 and TO-252
1.0
0.8 A TO-92 and Compak
1.5 A Devices
I
GT
= 12
碌A
MAX
1.0
0
1
2
3
4
RMS On-state Current [I
T(RMS)
] 鈥?Amps
T
C
= 25 藲C
Figure E5.16 Power Dissipation (Typical) versus RMS On-state Current
0.1
0.01
0.1
1
10
100
DC Gate Trigger Current (I
GT
) 鈥?mA
Figure E5.15 Typical Turn-on Time versus Gate Trigger Current
漏2004 Littelfuse, Inc.
Thyristor Product Catalog
E5 - 9
http://www.littelfuse.com
+1 972-580-7777


 1
1
 2
2
 3
3
 4
4
 5
5
 6
6
 7
7
 8
8
 9
9
 10
10
 11
11
 12
12
