IDT 79RC32355
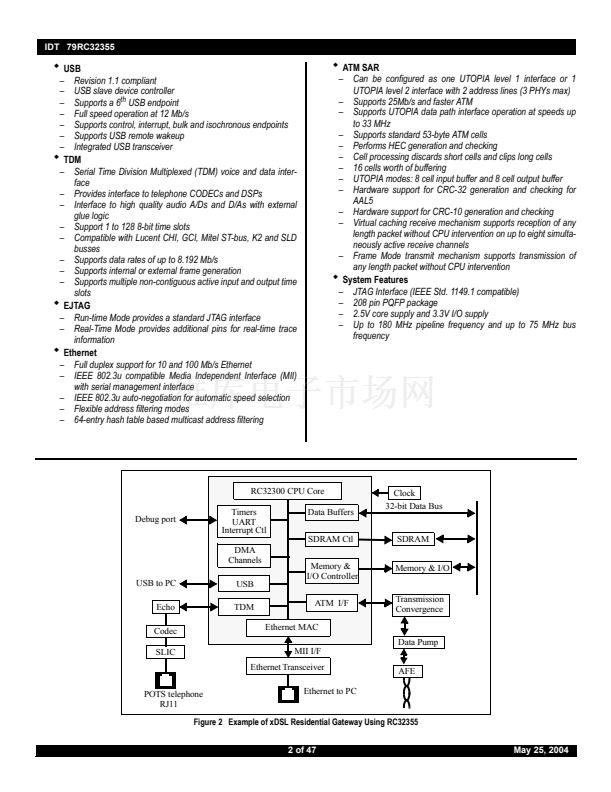
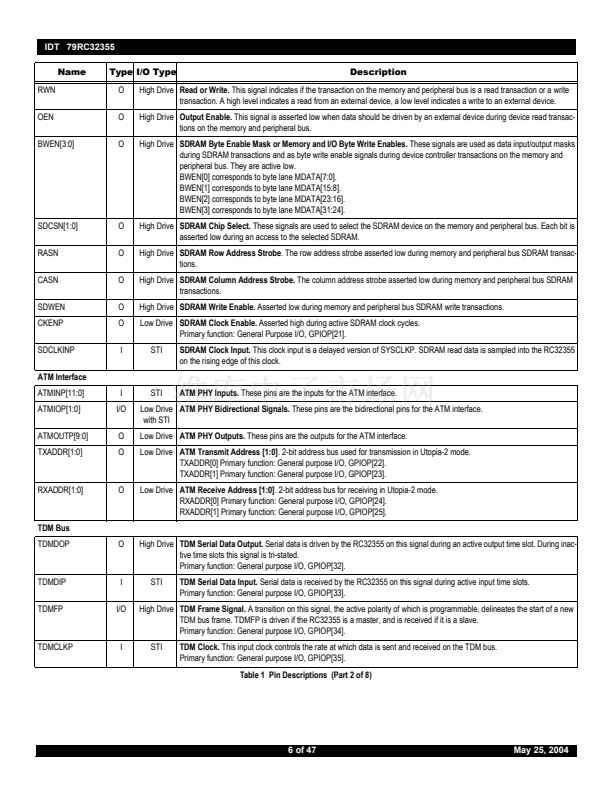
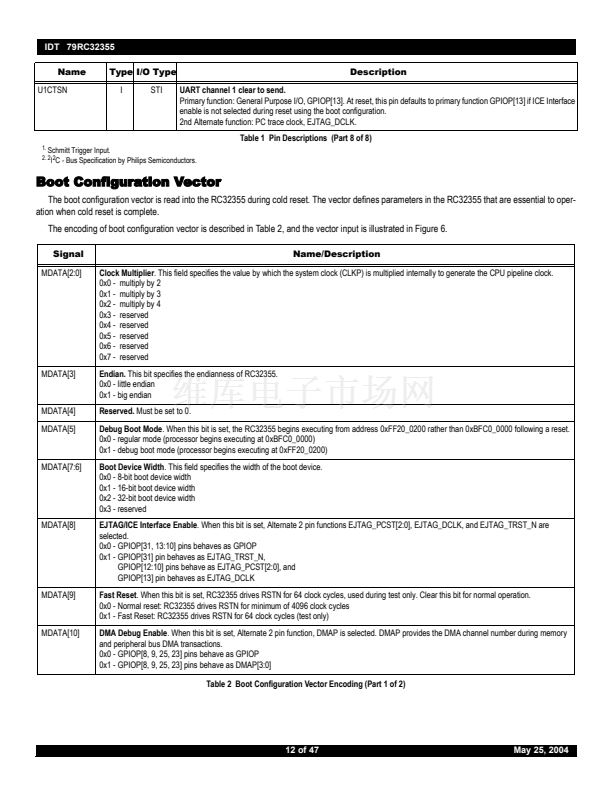
Power Curve
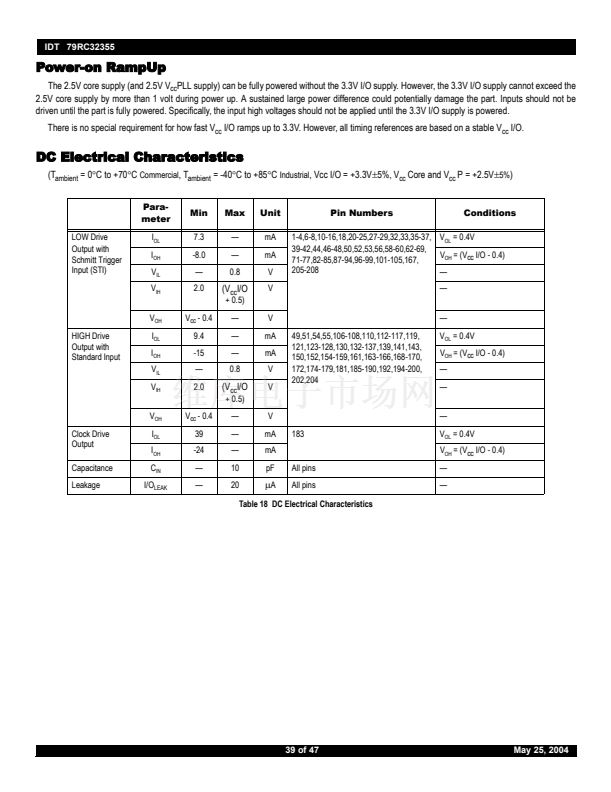
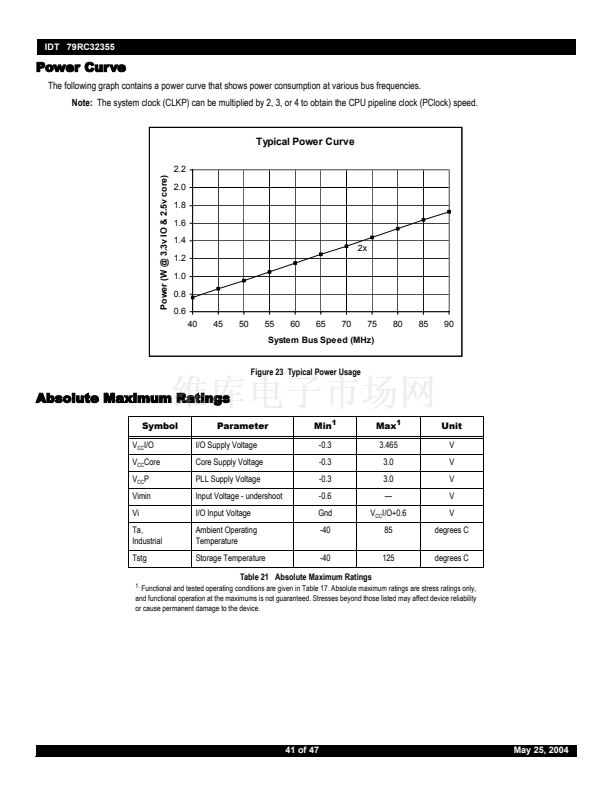
The following graph contains a power curve that shows power consumption at various bus frequencies.
Note:
The system clock (CLKP) can be multiplied by 2, 3, or 4 to obtain the CPU pipeline clock (PClock) speed.
Typical Power Curve
2.2
Power (W @ 3.3v IO & 2.5v core)
2.0
1.8
1.6
1.4
1.2
1.0
0.8
0.6
40
45
50
55
60
65
70
75
80
85
90
System Bus Speed (MHz)
2x
Figure 23 Typical Power Usage
Absolute Maximum Ratings
Symbol
V
CC
I/O
V
CC
Core
V
CC
P
Vimin
Vi
Ta,
Industrial
Tstg
1.
Parameter
I/O Supply Voltage
Core Supply Voltage
PLL Supply Voltage
Input Voltage - undershoot
I/O Input Voltage
Ambient Operating
Temperature
Storage Temperature
Min
1
-0.3
-0.3
-0.3
-0.6
Gnd
-40
-40
Max
1
3.465
3.0
3.0
鈥?/div>
V
CC
I/O+0.6
85
125
Unit
V
V
V
V
V
degrees C
degrees C
Table 21 Absolute Maximum Ratings
Functional and tested operating conditions are given in Table 17. Absolute maximum ratings are stress ratings only,
and functional operation at the maximums is not guaranteed. Stresses beyond those listed may affect device reliability
or cause permanent damage to the device.
41 of 47
May 25, 2004


 1
1
 2
2
 3
3
 4
4
 5
5
 6
6
 7
7
 8
8
 9
9
 10
10
 11
11
 12
12
 13
13
 14
14
 15
15
 16
16
 17
17
 18
18
 19
19
 20
20
 21
21
 22
22
 23
23
 24
24
 25
25
 26
26
 27
27
 28
28
 29
29
 30
30
 31
31
 32
32
 33
33
 34
34
 35
35
 36
36
 37
37
 38
38
 39
39
 40
40
 41
41
 42
42
 43
43
 44
44
 45
45
 46
46
 47
47
