鈩?/div>
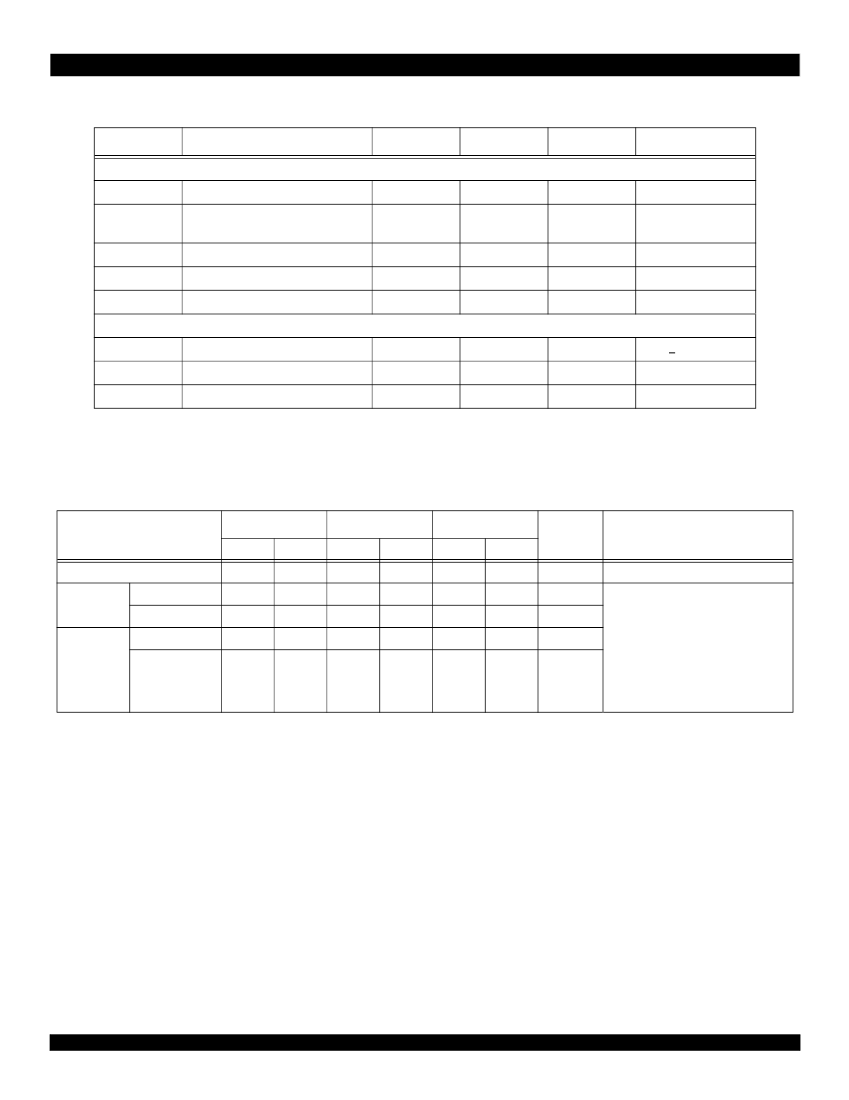
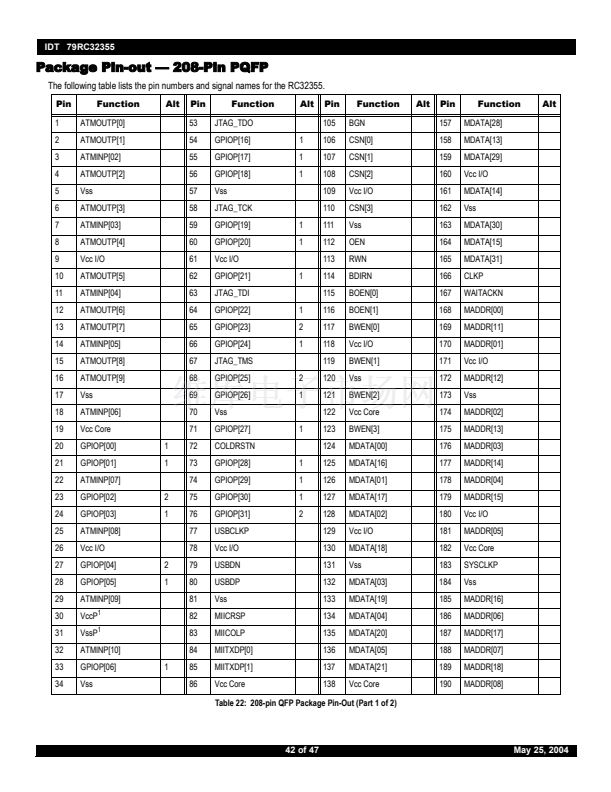
Table 19 USB Interface Characteristics
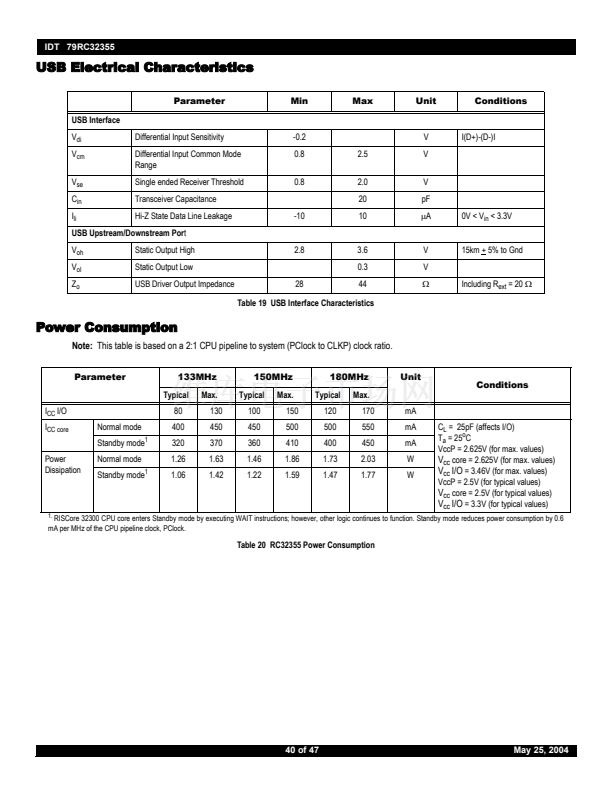
Power Consumption
Note:
This table is based on a 2:1 CPU pipeline to system (PClock to CLKP) clock ratio.
Parameter
133MHz
Typical
I
CC
I/O
I
CC core
Power
Dissipation
Normal mode
Standby mode
1
Normal mode
Standby mode
1
80
400
320
1.26
1.06
Max.
130
450
370
1.63
1.42
150MHz
Typical
100
450
360
1.46
1.22
Max.
150
500
410
1.86
1.59
180MHz
Typical
120
500
400
1.73
1.47
Max.
170
550
450
2.03
1.77
mA
mA
mA
W
W
C
L
= 25pF (affects I/O)
T
a
= 25
o
C
VccP = 2.625V (for max. values)
V
cc
core = 2.625V (for max. values)
V
cc
I/O
= 3.46V (for max. values)
VccP = 2.5V (for typical values)
V
cc
core = 2.5V (for typical values)
V
cc
I/O
= 3.3V (for typical values)
Unit
Conditions
RISCore 32300 CPU core enters Standby mode by executing WAIT instructions; however, other logic continues to function. Standby mode reduces power consumption by 0.6
mA per MHz of the CPU pipeline clock, PClock.
1.
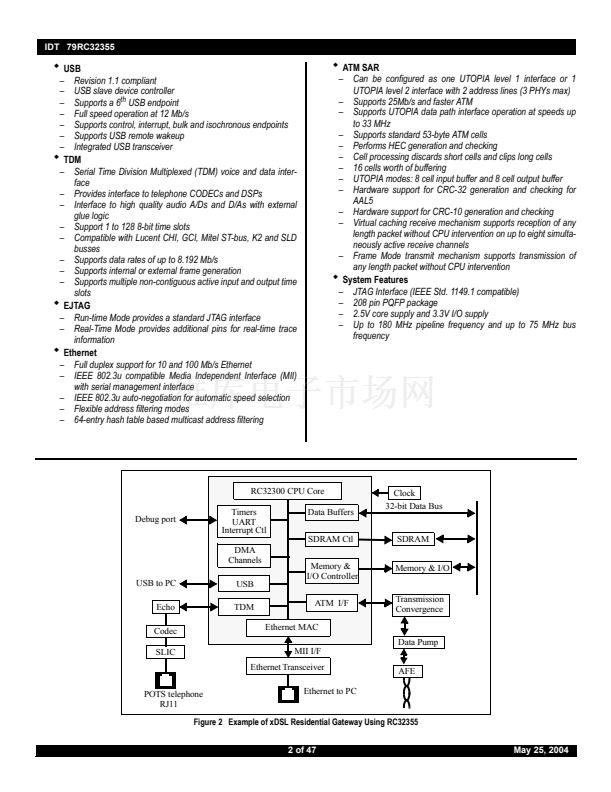
Table 20 RC32355 Power Consumption
40 of 47
May 25, 2004


 1
1
 2
2
 3
3
 4
4
 5
5
 6
6
 7
7
 8
8
 9
9
 10
10
 11
11
 12
12
 13
13
 14
14
 15
15
 16
16
 17
17
 18
18
 19
19
 20
20
 21
21
 22
22
 23
23
 24
24
 25
25
 26
26
 27
27
 28
28
 29
29
 30
30
 31
31
 32
32
 33
33
 34
34
 35
35
 36
36
 37
37
 38
38
 39
39
 40
40
 41
41
 42
42
 43
43
 44
44
 45
45
 46
46
 47
47
