1.5KExx
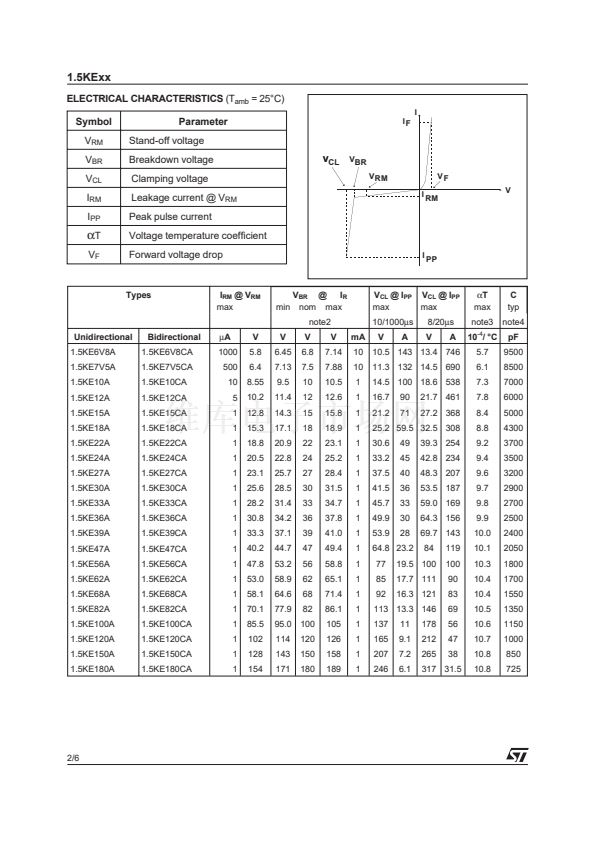
Fig. 2 :
Peak pulse power versus exponential pulse duration.
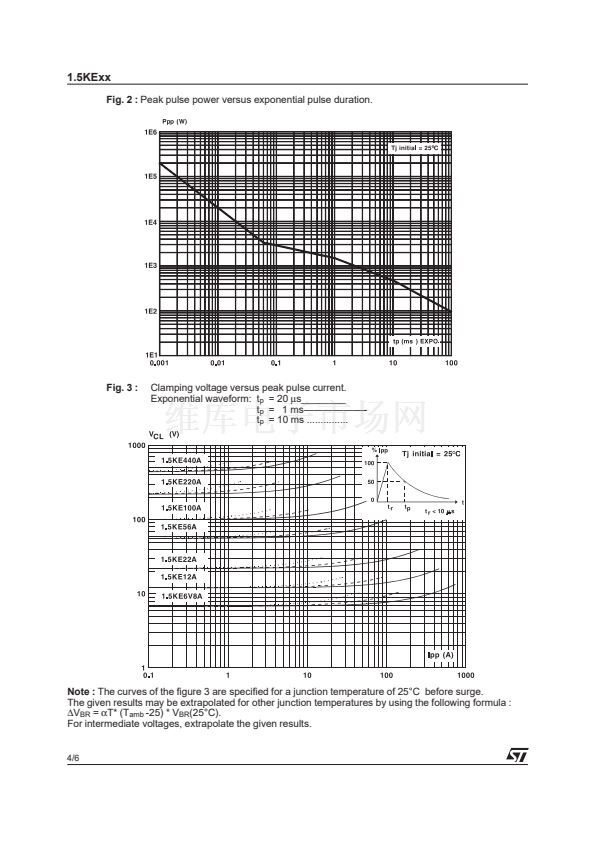
Fig. 3 :
Clamping voltage versus peak pulse current.
Exponential waveform: t
p
= 20
碌s________
t
p
= 1 ms鈥斺€斺€斺€斺€斺€?
t
p
= 10 ms ...............
Note :
The curves of the figure 3 are specified for a junction temperature of 25掳C before surge.
The given results may be extrapolated for other junction temperatures by using the following formula :
鈭哣
BR
=
伪T*
(T
amb
-25) * V
BR
(25掳C).
For intermediate voltages, extrapolate the given results.
4/6


 1
1
 2
2
 3
3
 4
4
 5
5
 6
6
